Data input
Decide for yourself whether data such as key figure values should be imported manually or automatically via an API interface.

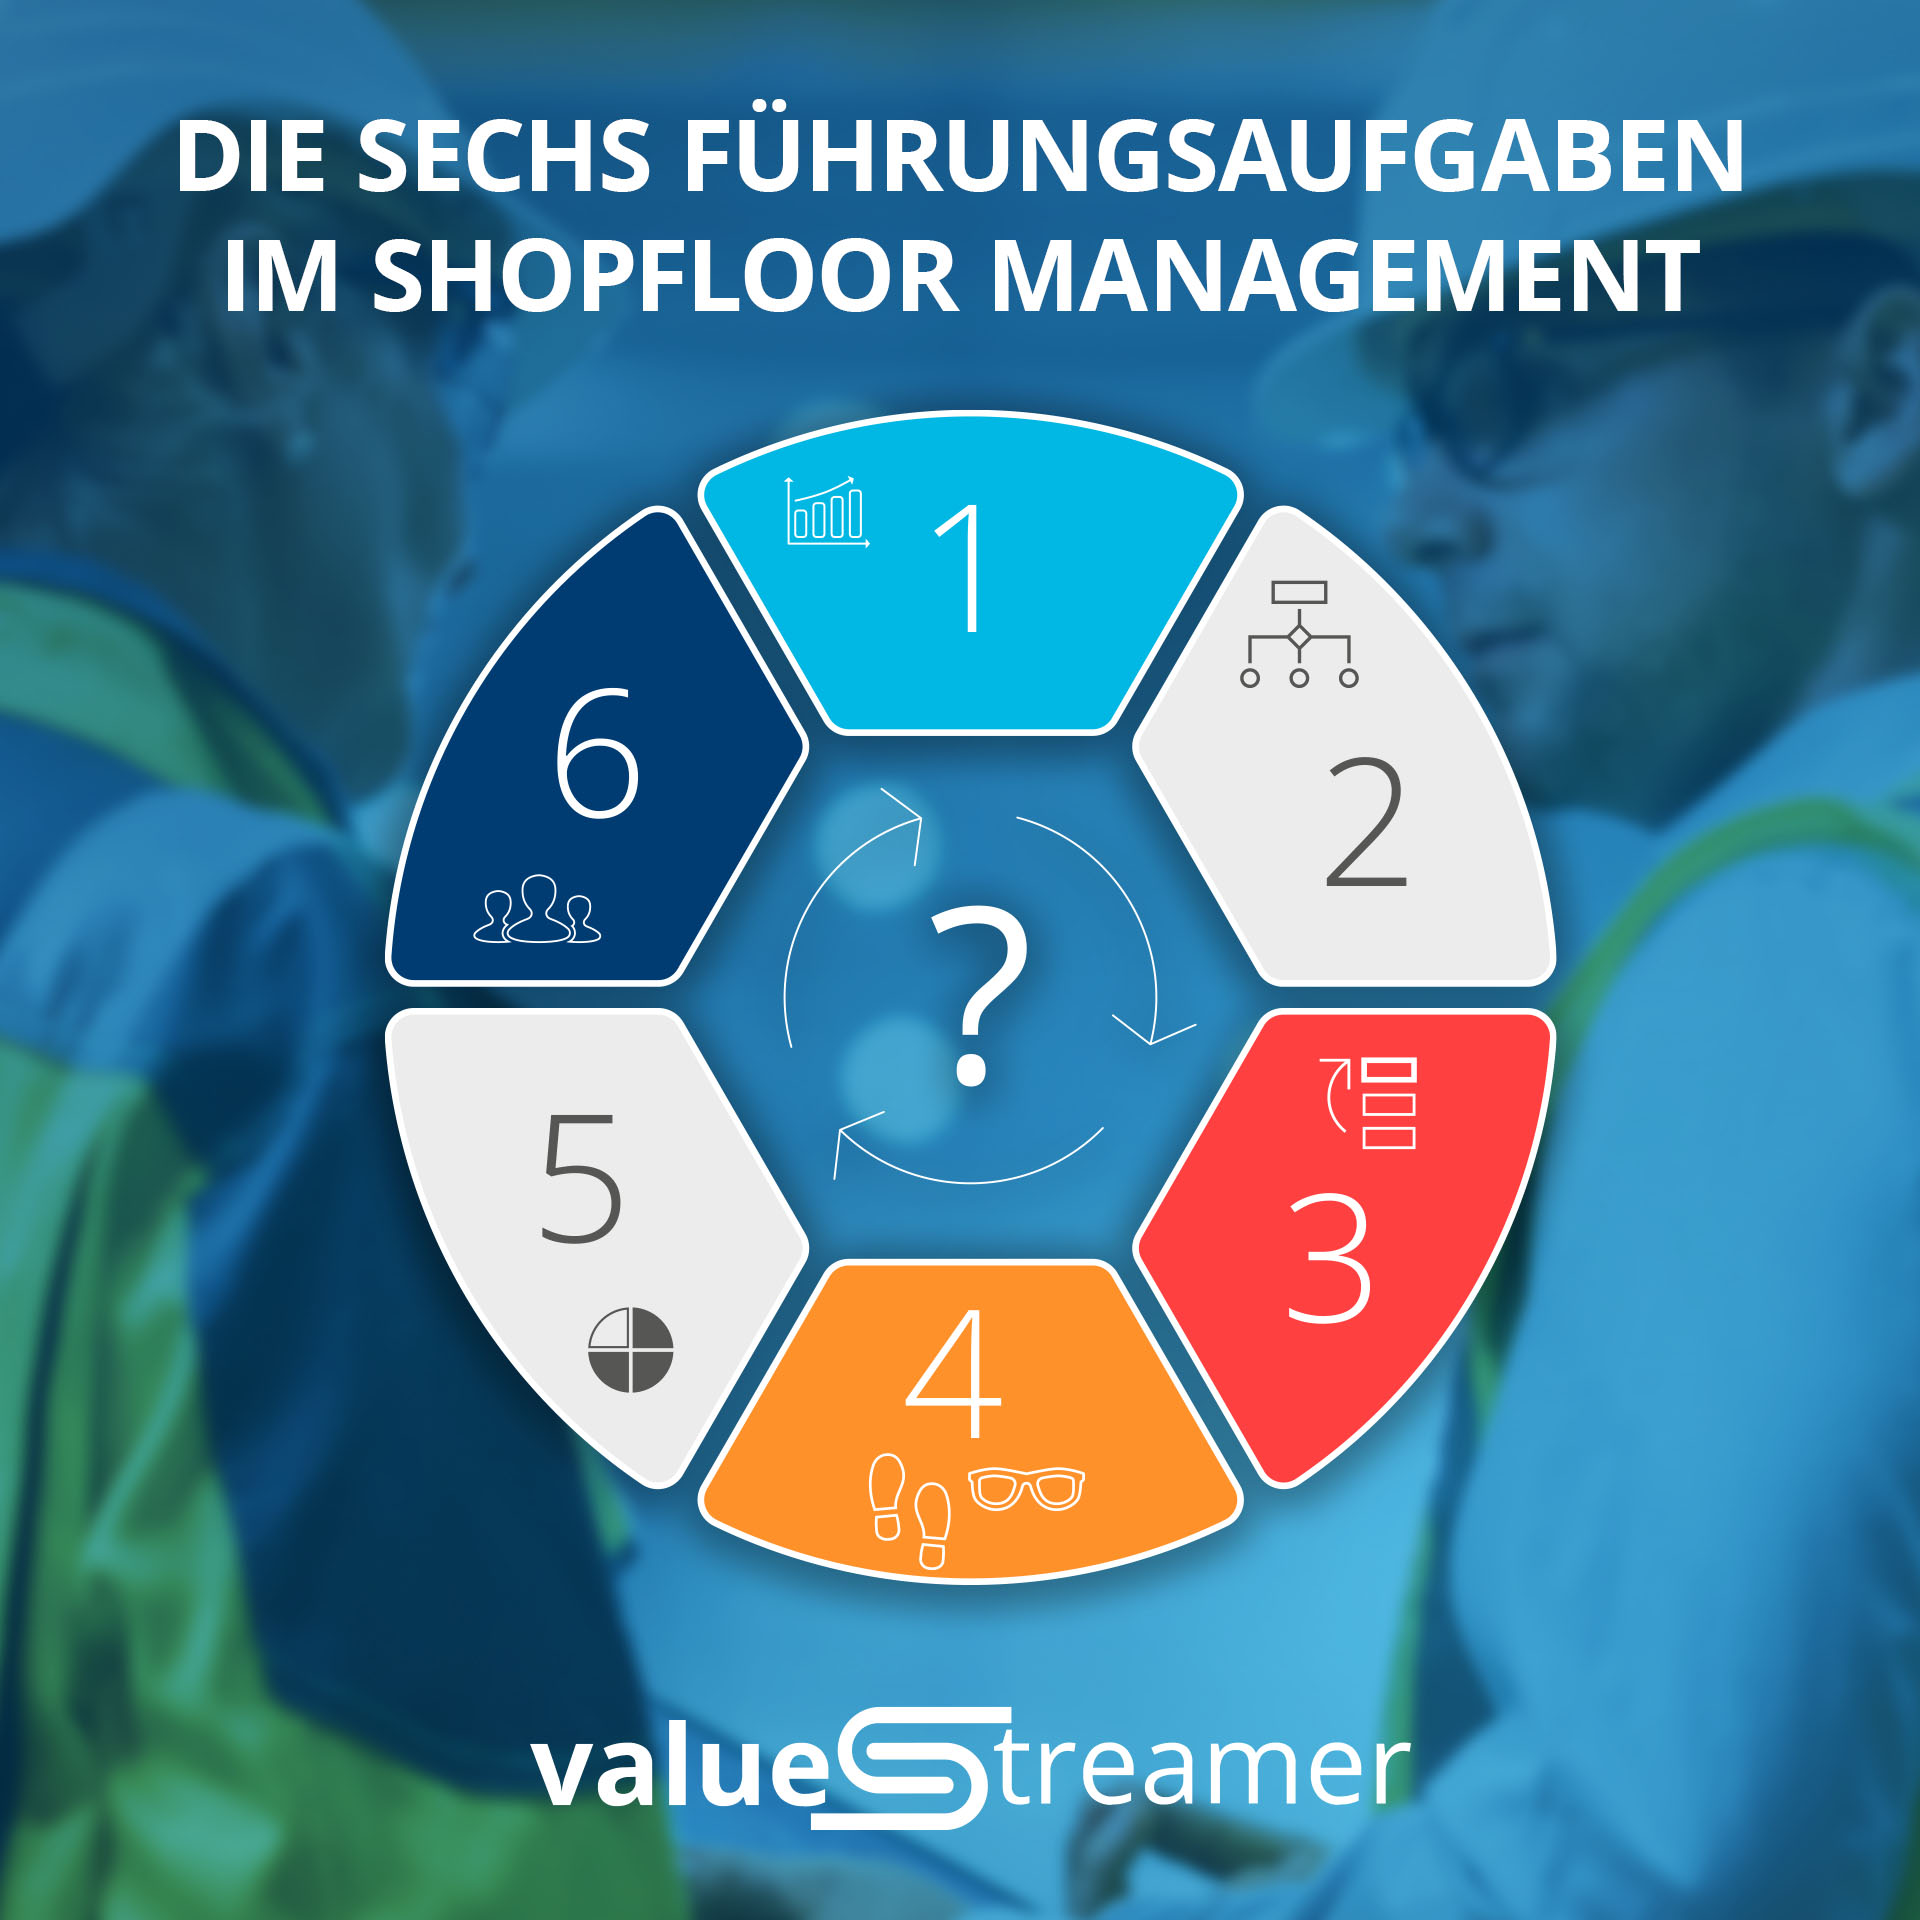
Inefficient communication, unclear responsibilities and subjective decision-making based on emotions rather than facts lead to delays, duplication of work and mismanagement. However, if information is exchanged in a structured manner, processes are coordinated and decisions are made on the basis of data, enormous efficiency gains can be achieved.
Optimize collaboration throughout your company. Transparent communication, clear decision-making channels and digital real-time information ensure smooth processes and sustainable success.
Avoid misunderstandings, reduce coordination efforts and increase not only the performance of your teams, but also the motivation and satisfaction of your employees with ValueStreamer® - because your collaboration is worth more.


CONFIGURE
The views of the digital boards can be individually configured and scaled.
This facilitates company-wide, comparable standardization of shopfloor management - across locations and company divisions.
Configure the following elements, among others:
Key figures
List elements
authorizations
teams
Process boards
Task boards
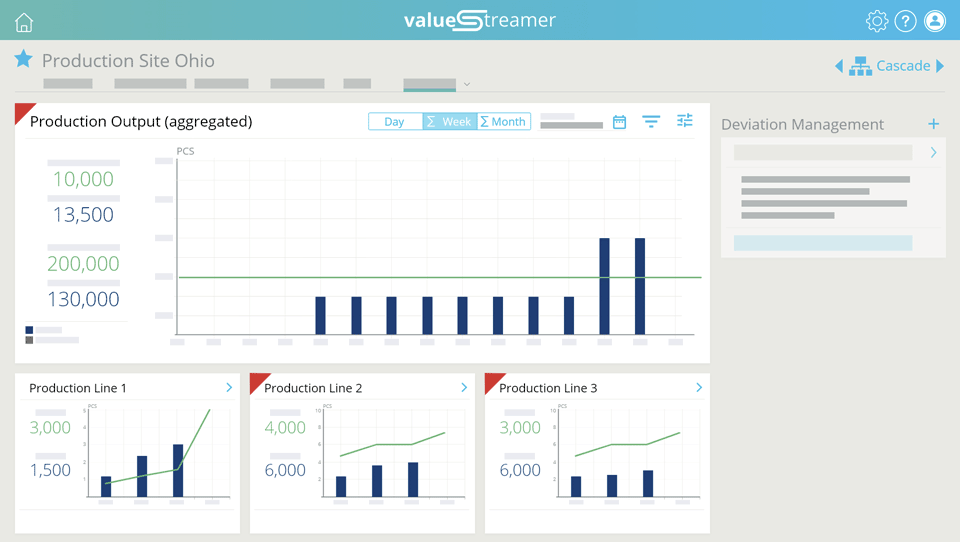
AGGREGATE & VISUALIZE DATA
Once data such as key figures have been entered, they are automatically aggregated along the team cascade and are immediately available to all participants
The REST API interface allows you to automatically import values from existing systems such as ERP or MES at any time
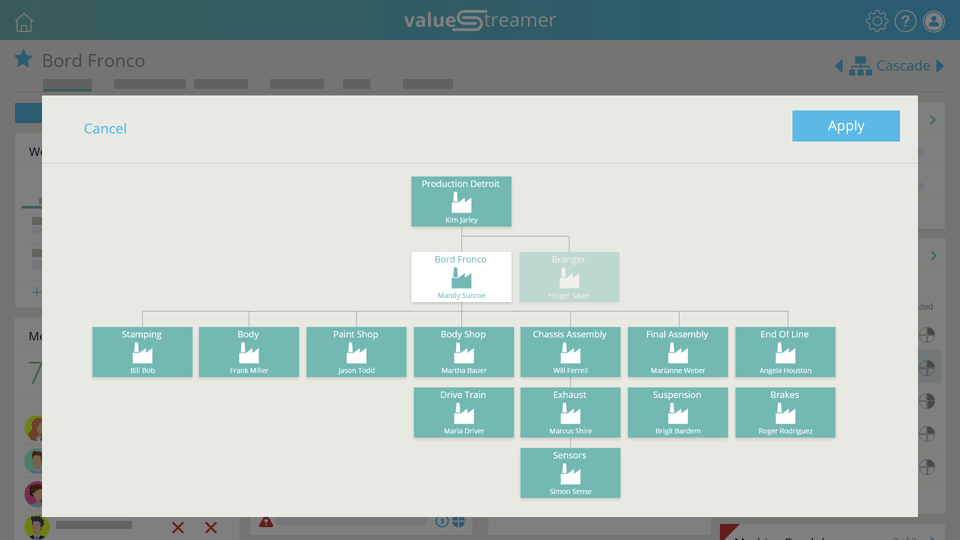
NETWORK & CASCADE
Manage dependencies between teams and departments effortlessly - 100% transparency with one click.
Link different dashboards together and cascade them with the cascade navigator
Display an overview of the relevant information with just a few clicks - right down to team level - and find out what is happening there in real time
Network processes across departments and locations


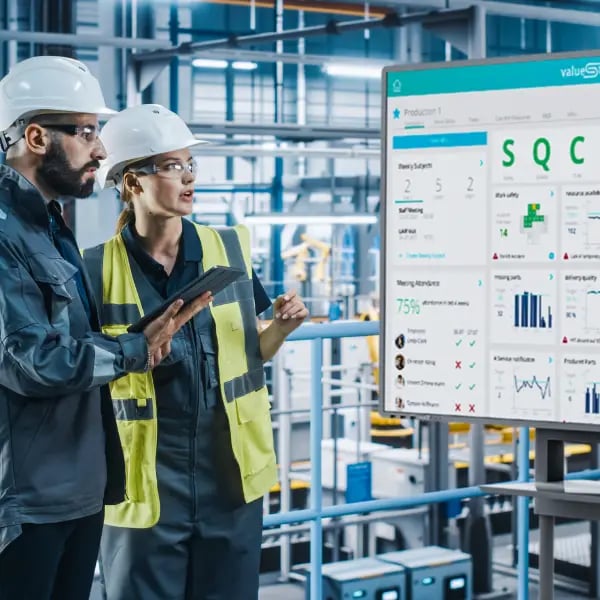
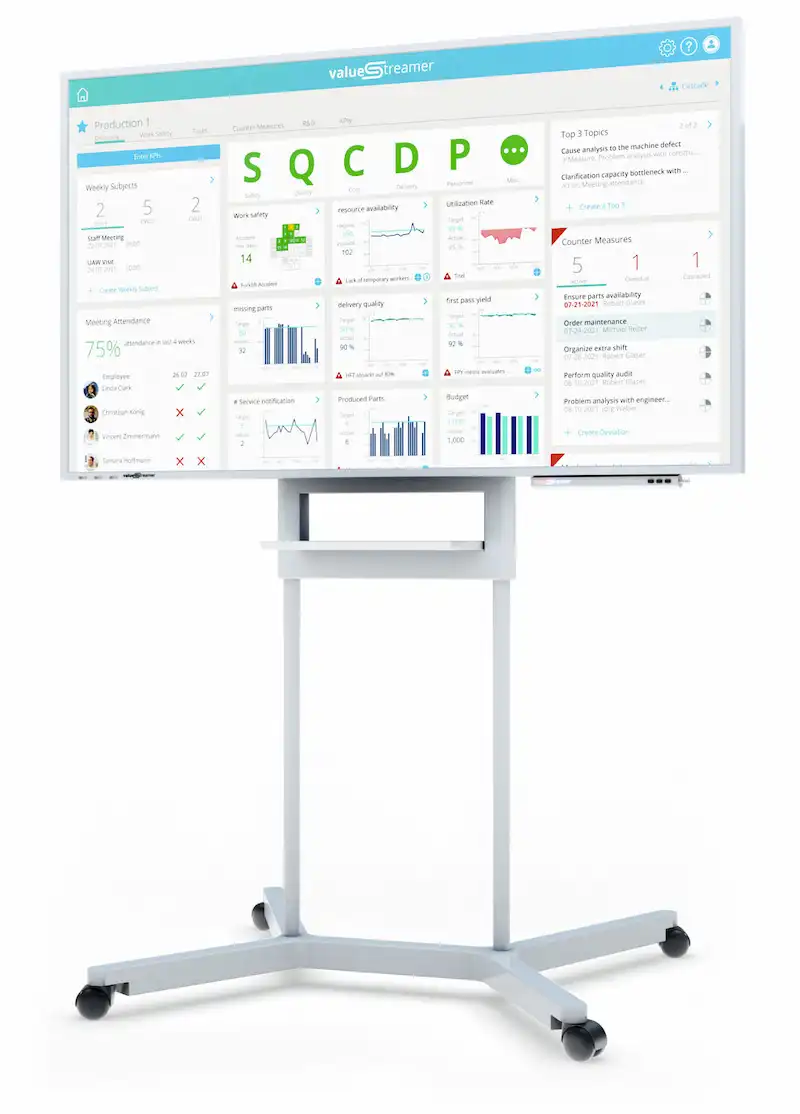
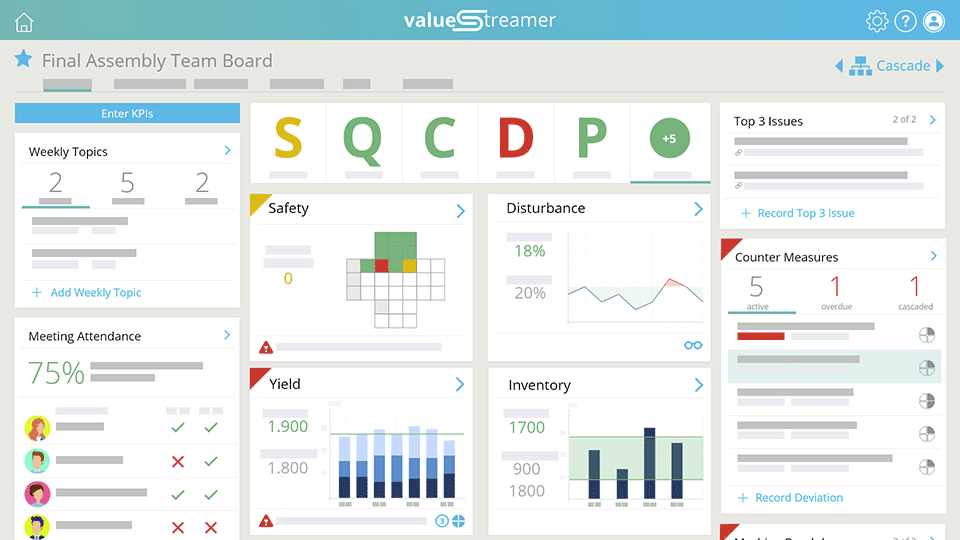
The team board (SQCDP board) gives you an overview of all team-relevant information - at the point of value creation.
The clear visualization enables you to react quickly and supports everyone involved in your activities.
Define column views individually (e.g. safety, quality, costs, etc.)
Create team-specific lists and KPIs based on existing templates
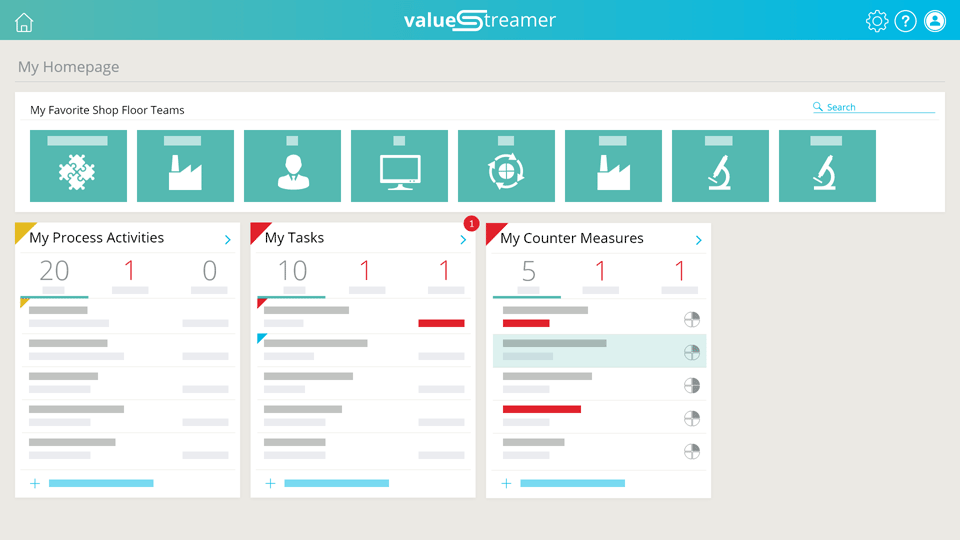
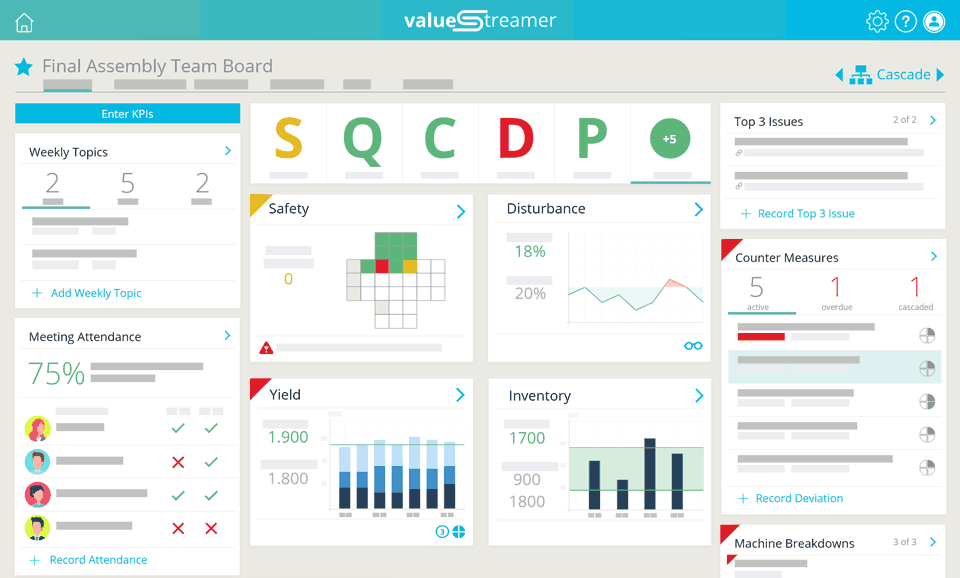
The personal dashboards provide all those involved with the data relevant to them - at a glance.
This gives everyone an overview of their open activities from the processes, tasks or measures involved.
This improves self-management and enables quick decision-making based on up-to-date information.
The need for coordination is reduced, prioritization is made easier and collaboration is more efficient.
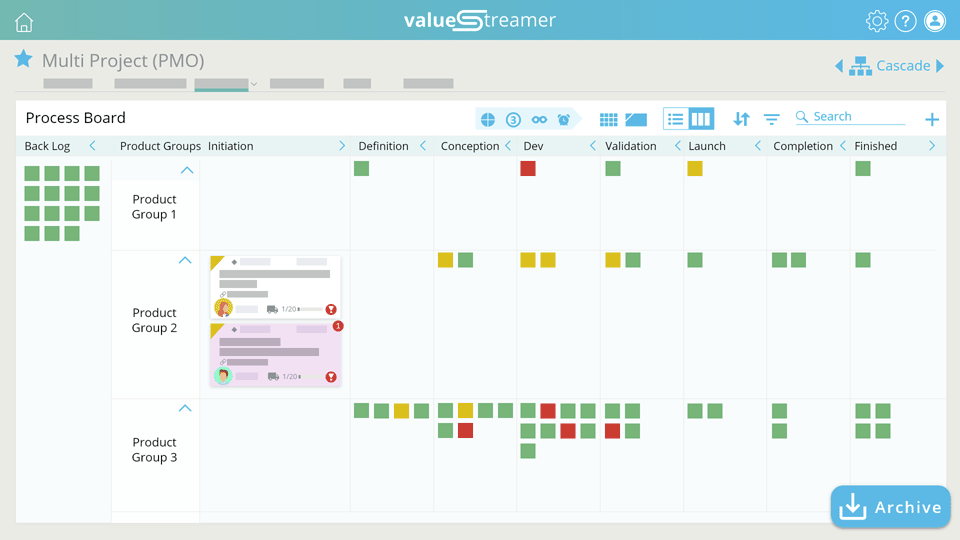
With the process and Kanban boards, you can visualize and control all company processes effortlessly.
You always have an overview of the relevant process tasks of different projects as well as the process progress in real time.
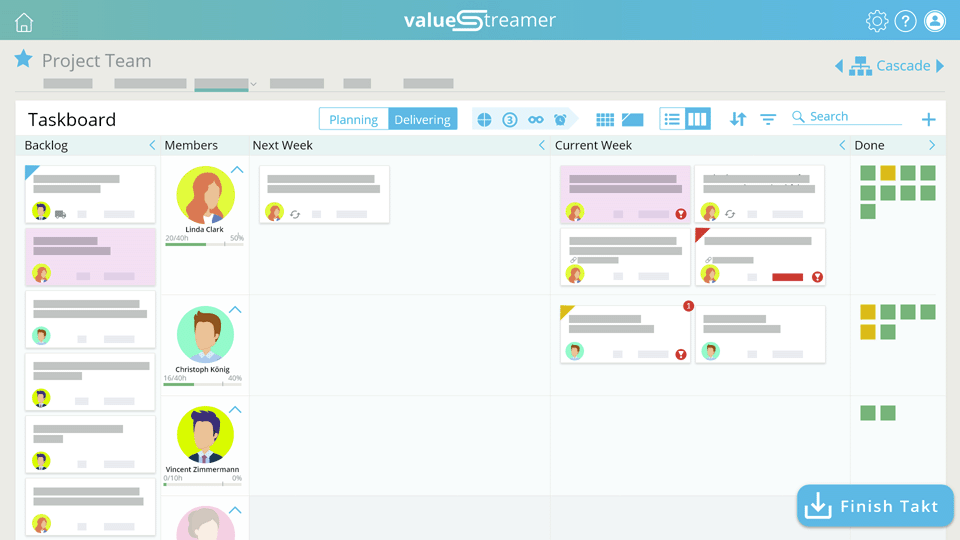
Use the task board to visualize relevant workflows and tasks on Kanban-style dashboards.
Record and manage work tasks centrally, plan upcoming requirements in detail and actively manage resource utilization.