
Methods
PDCA fixes, digital A3 report with 5 Whys and Ishikawa
Prioritizing
Pareto from the captured deviations, by frequency and duration, per team and department
Evidence
Check effectiveness, secure the standard, A3 and countermeasures in the archive
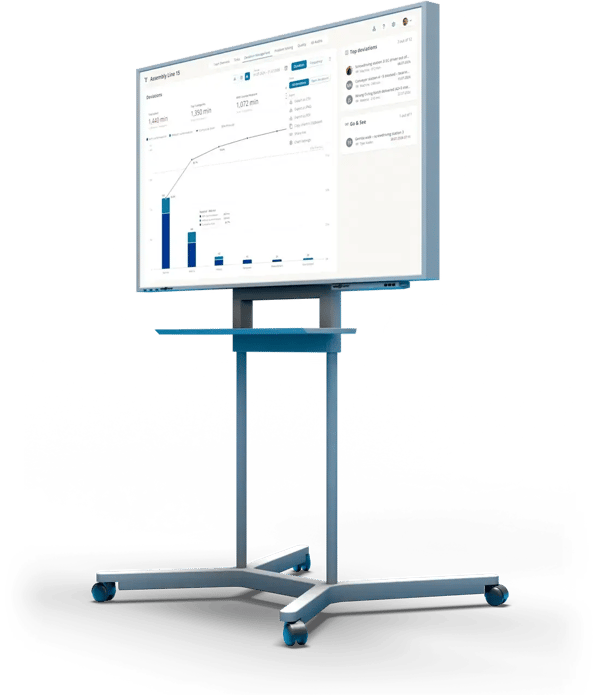
In short
What is structured problem solving?
Structured problem solving is a fixed, step-by-step approach teams use to find the root cause of a problem and eliminate it for good, instead of just fixing the symptom. In manufacturing, it follows the PDCA cycle: spot and prioritize the problem, analyze the cause, implement countermeasures, check the effect and secure it as a standard.
For clear cases, a PDCA countermeasure is enough. For critical or recurring problems, the A3 report is the tool of choice.
The problem solving process in 4 steps
Spot and prioritize the problem
Deviations are captured where they happen. The Pareto shows which cause occurs most often and costs the most time.
In ValueStreamer: deviation management on the digital board, Pareto created automatically.
Choose the method
Clear cause, small scope: PDCA. Unclear cause, recurring or critical: A3 with 5 Whys and Ishikawa.
In ValueStreamer: both paths start right from the deviation.
Implement countermeasures
Every countermeasure has an owner and a due date. It stays visible across teams, areas and shifts.
In ValueStreamer: countermeasure list, cross-functional task management, escalation through the cascade.
Check the effect and standardize
Only when the KPI shows that the problem stays away is the countermeasure confirmed and turned into the standard.
In ValueStreamer: effectiveness check, ISO-compliant archive of all A3 reports, searchable across sites.
Pareto analysis
Which problem first?
A Pareto sorts causes by their impact. Usually, a few causes explain most of the losses. What matters is what you sort by: the most frequent cause is rarely the most expensive one. Try it out.
No. 1 by metric
Costs calculated with your rates: we value duration and scrap with your internal cost rates. In this example, €85 per line hour and €2,400 per metric ton of scrap.
Example plant, illustrative values, not a customer result. Assembly department with four teams; team = line 2.
Values as a table
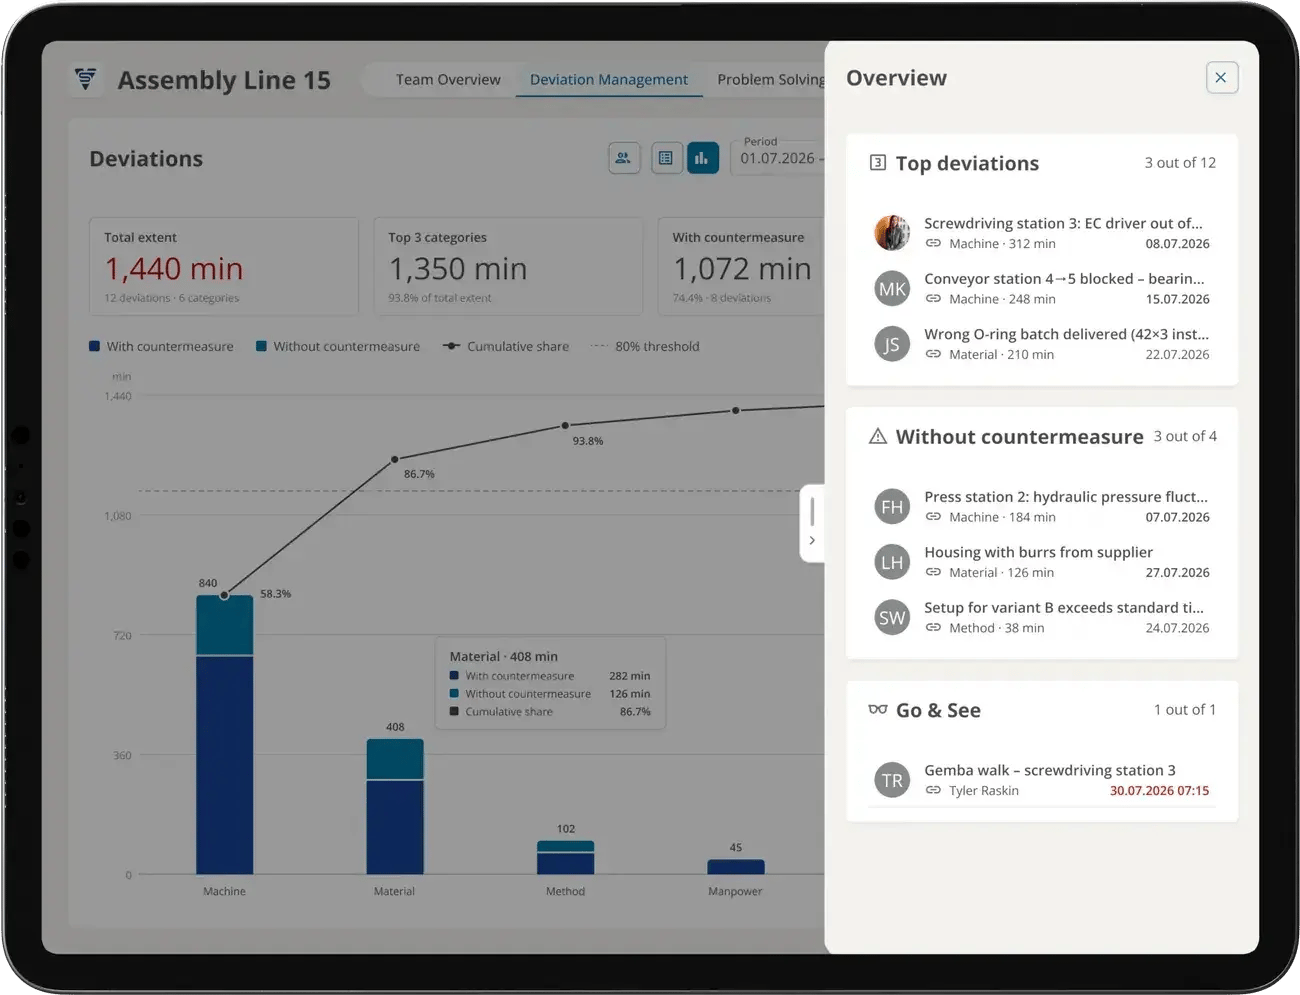
Assembly line 15: 1,440 minutes from 12 deviations, the top 3 make up 93.8 %
How it looks in the product
The Pareto on the team board
Every deviation the team captures at the board goes into the Pareto with its category and duration. It shows the cumulative share with the 80 % threshold and separates what already has a countermeasure from what does not.
- By duration or frequency, per team and for the level above
- With and without countermeasure in one bar
- Top deviations and Go & See right next to it
Problem solving methods
PDCA or A3: which method when?
| Method | Used for | Typical scope | Who | In ValueStreamer |
|---|---|---|---|---|
| Pareto analysis | Deciding which problem to tackle first | ongoing, every leadership meeting | Team, department, plant | automatically from the captured deviations |
| PDCA fix | Smaller deviations with a visible cause | Days | Team at the line | countermeasure right from the deviation |
| A3 report | Critical or recurring problems with an unclear cause | Weeks | Team with support functions, cross-functional | digital A3, guided step by step |
| 5 Whys | Following the chain of causes down to the root | Part of the A3 | A3 team | included in the A3 |
| Ishikawa | Collecting possible causes by man, machine, material, method, measurement and environment | Part of the A3 | A3 team | included in the A3 |
Rule of thumb: if the cause is clear, PDCA is enough. If the problem comes back, it belongs in an A3.
The digital A3 guides the team through problem solving in seven steps: background and relevance, problem description, target state, cause and effect, root cause analysis, implementation plan, standardization. Immediate countermeasures sit right on the deviation.
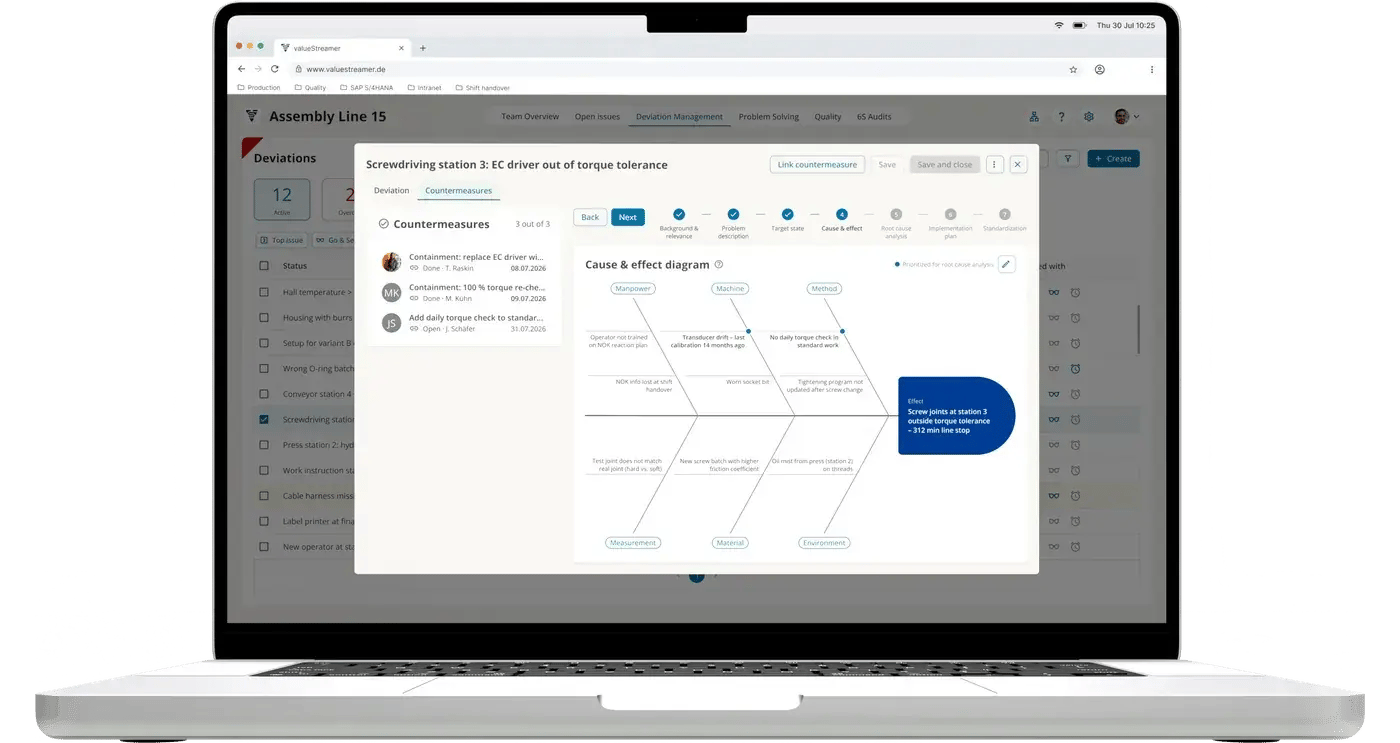
A3 step 4 of 7: Ishikawa for the deviation at screwdriving station 3
From lean practice
Problem solving that works on the shop floor
ValueStreamer grew out of lean consulting (formerly STAUFEN.AG). The problem solving process, from the Pareto to the A3 to the standard, comes from shop floor management practice in many plants.
- REST API
- Hosted in the EU
- On-premises available
- ISO/IEC 27001:2022 certified
117,000+
deviations closed
53,000+
countermeasures completed
4,900+
teams work with ValueStreamer
4 weeks
from kickoff to go-live
Totals as of October 2026.
FAQ
Frequently asked questions
A fixed, step-by-step approach to finding the root cause of a problem and eliminating it for good, instead of just fixing the symptom. In manufacturing, it follows the PDCA cycle and uses tools such as Pareto analysis, 5 Whys, Ishikawa and the A3 report.
The fixed sequence a problem goes through from detection to solution: spot and prioritize, choose a method, analyze the cause, implement countermeasures, check the effect and standardize. The process makes sure every team works the same way and results are comparable.
Common in manufacturing are PDCA for simple fixes, the A3 report for complex problems, 5 Whys and Ishikawa for root cause analysis, and Pareto analysis for prioritizing. For customer complaints, the 8D report is standard; for data-driven projects, DMAIC from Six Sigma.
PDCA is the cycle of Plan, Do, Check, Act. The A3 report is a tool that documents this cycle on one sheet: background, current state, target, root cause analysis, countermeasures and follow-up. PDCA is enough for clear cases; the A3 pays off for critical or recurring problems.
It sorts causes in descending order of impact and shows the cumulative share. That makes visible that a few causes often explain most of the losses (the 80/20 rule). The metric matters: sorted by frequency, duration or cost, a different cause often comes out on top.
A problem solving approach on a single A3 sheet (about 11 × 17 inches), originally from Toyota. In fixed sections, it leads from the problem through root cause analysis to countermeasures and their follow-up. In ValueStreamer, the A3 is digital, with 5 Whys and Ishikawa, and is archived once completed.
The Pareto shows causes by frequency and duration, for every team and the level above. Using your internal cost rates, such as the hourly rate and the cost per ton of scrap, we convert these values into money.
Implementation takes about 4 weeks. ValueStreamer runs in the browser and is hosted in the EU (Azure West Europe). On-premises is available.
See your own Pareto live
A 30-minute demo built around your questions: from the deviation on the board to the A3 and the verified countermeasure.