🔍 Contents
- How it works
- Display of outdated aggregated KPIs
- Special logic for CORE KPIs
- Configuration in system administration
- Tips & Best Practices
- FAQ
🛠️ How it works
Basic principle:
A KPI tile is highlighted in yellow (10% opacity) if the displayed values are outdated or incomplete. This applies to both standard and focus mode tiles.
Criteria for “outdated” values:
Evaluation depends on the selected data point and recording interval configured in the KPI editor:
Current value
-
Interval = Day: older than today
-
Interval = Week: older than this calendar week
-
Interval = Month: older than this calendar month
Last value
-
Interval = Day: older than yesterday
-
Interval = Week: older than last calendar week
-
Interval = Month: older than last calendar month
ℹ️ Note: Only confirmed forecast actual values or regular actual values are taken into account. Unconfirmed forecast values are treated as not available.
ℹ️ Note: Evaluation always refers to the team time zone defined in the team administration.
📸 Screenshot: Tile with yellow highlight for outdated values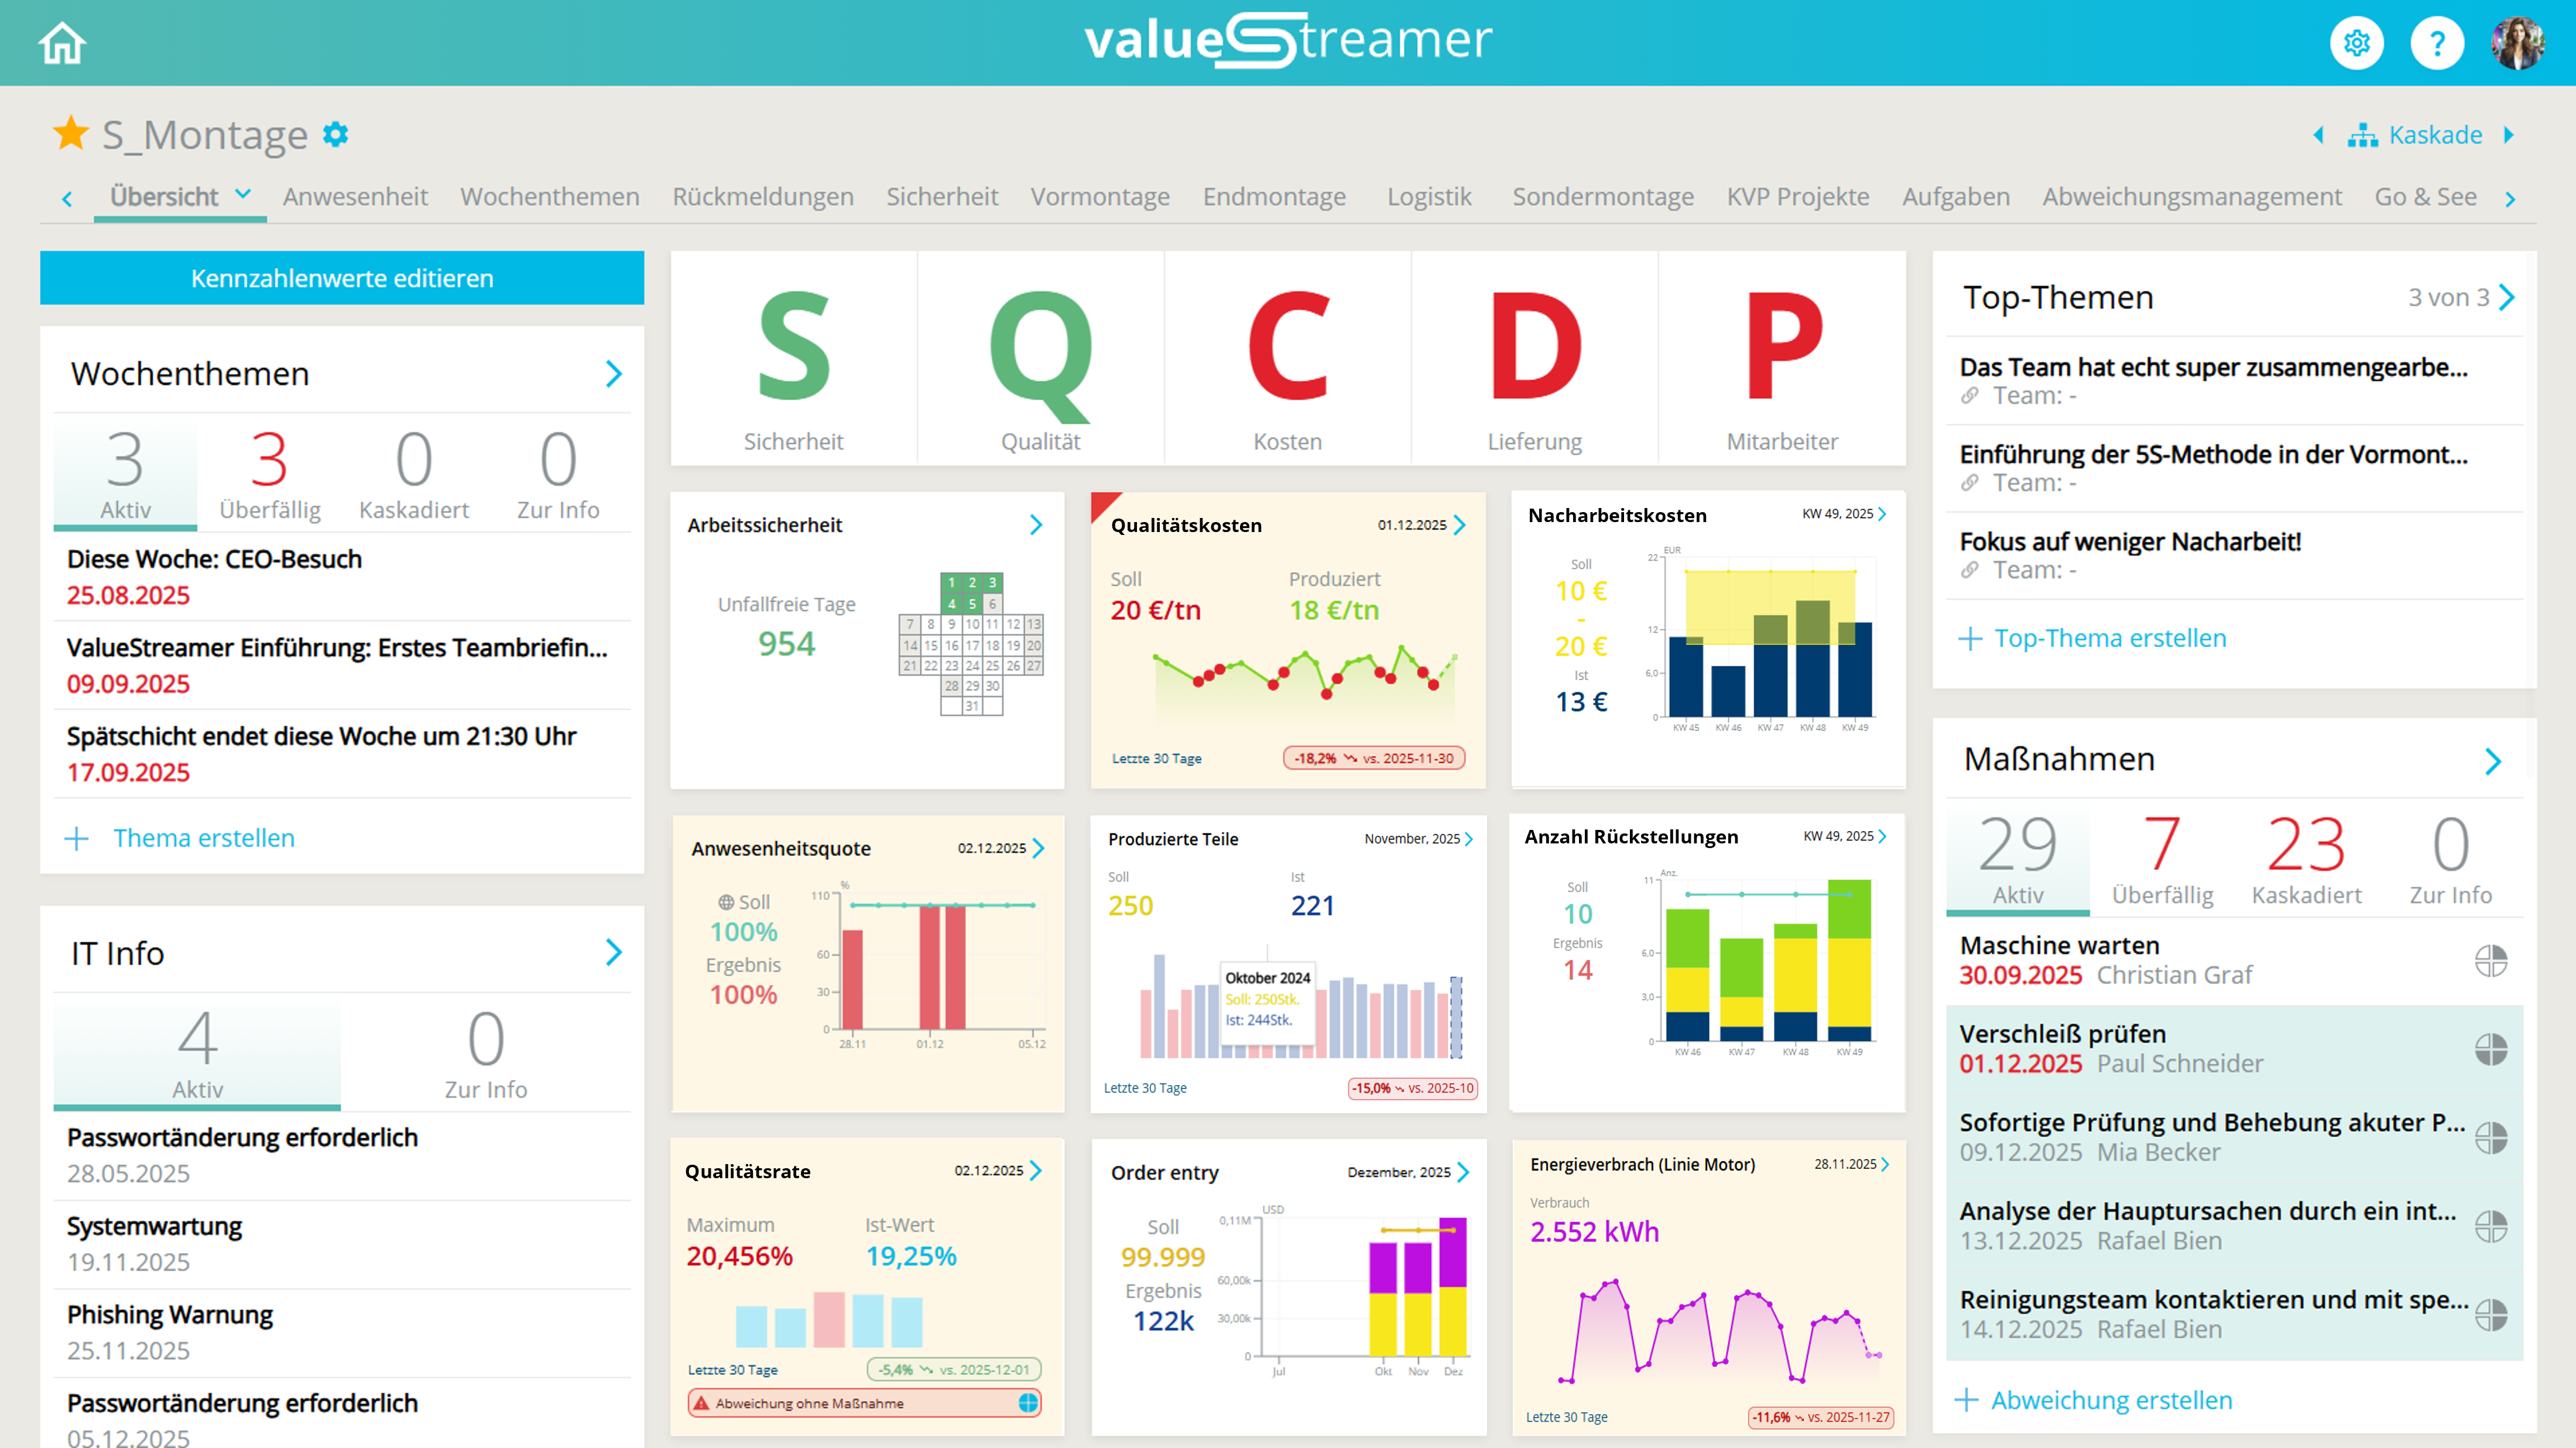
🧩 Display of outdated aggregated KPIs
An aggregated KPI is considered outdated if at least one of the following sub-tiles is outdated:
-
Child tiles (e.g. subteams)
-
Sub-KPIs
-
Team contribution (if recording along the cascade is activated)
All affected tiles – including the aggregated parent tile – are highlighted in yellow.
📸 Screenshot: Aggregated KPI with outdated sub-tile in detail view
🧩 Special logic for CORE KPIs
Special case “Work Safety”:
-
If “Last working day” is selected as the data point, the evaluation checks the last working day without a value.
-
If “Current working day” is selected, the latest defined working day must contain a value.
Never outdated:
-
Cumulative Flow Diagram (CFD)
-
Adherence to schedule (automatically updated daily)
Outdated if no current data:
-
Hitrate
-
Level of disturbance
⚙️ Configuration in system administration
In the system administration under “Default settings”, the KPI visual behavior can be centrally configured.
-
Toggle: Highlighting out-dated values
-
Default state: Enabled (green)
📸 Screenshot: Default setting – Highlighting out-dated values enabled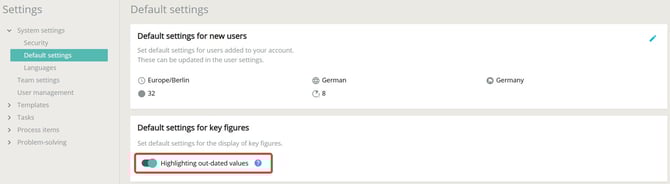
If the toggle is disabled, no yellow highlighting of outdated KPI values will occur.
✨ Tip: Clicking the blue question mark next to the toggle opens a contextual explanation about data up-to-dateness.
📸 Screenshot: Help dialog on data up-to-dateness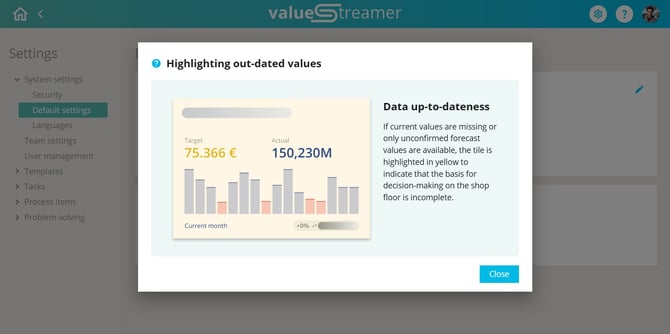
✨ Tips & Best Practices
- Use the yellow highlighting as a prompt to check data quality in KPI maintenance.
- Establish fixed routines within the team for daily or weekly KPI updates.
- In aggregated views, address outdated sub-tiles directly during reviews.
- Onboard new team members with a short explanation of this function (e.g. in training).
- Use the "?" context icon as a built-in explanation tool in the interface.
❓ FAQ
How can I tell if a KPI tile contains outdated values?
The tile will be displayed with a yellow background (10% opacity).
Which data is considered “up to date”?
This depends on the recording interval (day/week/month) and the selected data point in the KPI editor.
Are unconfirmed forecast values counted?
No. Only confirmed forecast actuals or actual values are considered valid.
Does the visual marking also apply to aggregated KPIs?
Yes. If sub-tiles or team contributions are missing, the aggregated tile is also marked as outdated.
Can I disable the feature?
Yes, via the system settings toggle “Highlighting out-dated values”.