🧮 Building and Designing KPI Charts in the KPI Dashboard
This article provides an overview of common chart types in the KPI dashboard and uses concrete KPI examples to explain how they are structured, what data they are based on, and how to interpret the visualizations.
🔍 Contents
-
Why a well-thought-out KPI dashboard structure matters
-
Chart types and matching KPIs
-
Tips for dashboard design
🎯 Why a Well-Thought-Out KPI Dashboard Structure Matters
A well-designed KPI dashboard supports quick decision-making and targeted process control. Choosing the right chart type and corresponding KPIs is crucial for identifying deviations early and deriving appropriate actions.
🛠️ Chart Types and Matching KPIs
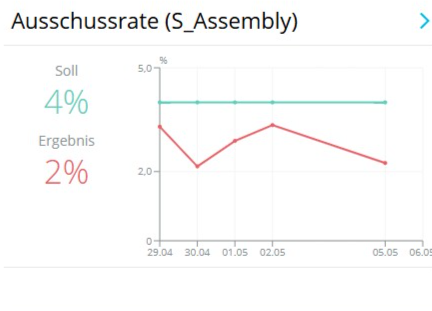
📈 Time Series Chart: Scrap Rate (%)
-
KPI: Scrap Rate
-
Use Case: Quality monitoring over time
-
Chart Type: Line or scatter plot with a target line
-
Required Data: Actual scrap rate values, target value (e.g., 4%)
📸 Screenshot: Scrap rate over time
📉 Target Deviation: Open Audit Findings
-
KPI: Open Audit Findings
-
Use Case: Action tracking and audit follow-up
-
Chart Type: Time series with a target line at 0
📸 Screenshot: Audit findings over time
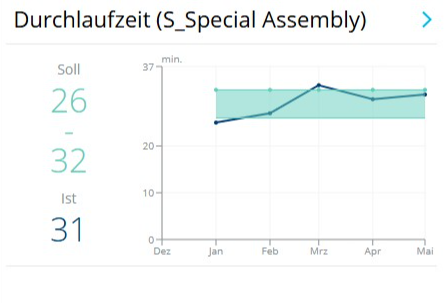
⏱️ Time-Based KPI: Lead Time
-
KPI: Lead Time (in minutes)
-
Use Case: Process optimization and takt time monitoring
-
Chart Type: Line chart with min/max limits
📸 Screenshot: Lead time within target range
🏗️ Bar Chart with Target Limit: Machine Downtime > 2 h
-
KPI: Machine Downtime
-
Use Case: Analyzing production disruptions
-
Chart Type: Bar chart with a target limit line
📸 Screenshot: Machine downtime with threshold
📊 Multi-Bar: Deviation Overview by Category
-
KPI: Deviations per Category/Month
-
Use Case: Identifying recurring root causes
-
Chart Type: Multi-bar per month
📸 Screenshot: Deviation overview with category bars
📅 Stacked Bars: Workforce Planning
-
KPI: Workforce Planning
-
Use Case: Visualizing workforce coverage needs
-
Chart Type: Stacked bars with traffic light colors
📸 Screenshot: Stacked workforce coverage
🚦 Traffic Light Logic: Production Target Achievement
-
KPI: Production Quantity
-
Use Case: Tracking production goals
-
Chart Type: Bar chart with color logic and target line
📸 Screenshot: Target achievement with traffic light
📚 Cumulative Flow Diagram (CFD): Project Status
-
KPI: CFD (Multi-Project Board – S_PMO)
-
Use Case: Identifying project inventory and bottlenecks
-
Chart Type: Cumulative area/stacked chart
📸 Screenshot: CFD with project status colors
✨ Tips & Best Practices
-
Use traffic light logic specifically to highlight critical KPIs.
-
Avoid too many different chart types in one dashboard – this helps maintain clarity.
-
Use KPI dashboards differently for operational and strategic control (e.g., shop floor vs. management board).