🔍 Contents
-
Why is this topic important?
-
Prerequisites
-
Step-by-step: Recording KPI values
1️⃣ From the Team Overview
2️⃣ Directly in the KPI
3️⃣ Along the KPI Cascade (new)
4️⃣ Via REST API -
Tips & Notes
-
FAQ
📌 Why This Topic Is Important
KPIs form the decision-making foundation in both operational and strategic management. Only regularly maintained and accurate values allow for transparent control and early detection of the need for action.
✅ Prerequisites
-
Write permissions in the relevant team
-
The KPI has already been created by the system administrator
🛠️ Step-by-Step: Entering KPI Values
1️⃣ From the Team Overview
👉 Best for quickly entering multiple values at once.
-
Go to the Overview tab of your team.
-
Click "Enter KPI values" at the top.
📸 Screenshot: "Enter KPI values" button
-
A dialog opens showing all KPIs recorded for that team.
-
Enter the values for each category (e.g., sick days, total quantity).
📸 Screenshot: entry form with multiple KPIs -
Click "Apply changes" to save.
📸 Screenshot: save button
2️⃣ Directly in the KPI
👉 Ideal for detailed entry of a single KPI.
-
Go to the KPIs tab and open the desired KPI (e.g., scrap rate).
-
Click the "+" icon in the upper right area of the chart.
📸 Screenshot: "+" icon for value entry
-
Enter the current value (e.g., defective parts & produced parts).
-
Confirm via "Apply changes".
3️⃣ Along the KPI Cascade (new)
👉 With this feature, values can be recorded not only at the lowest level but also at higher levels of a KPI cascade.
-
Open the KPI Editor and activate the option “Record values along the cascade”
📸 Screenshot: KPI Editor with aggregation option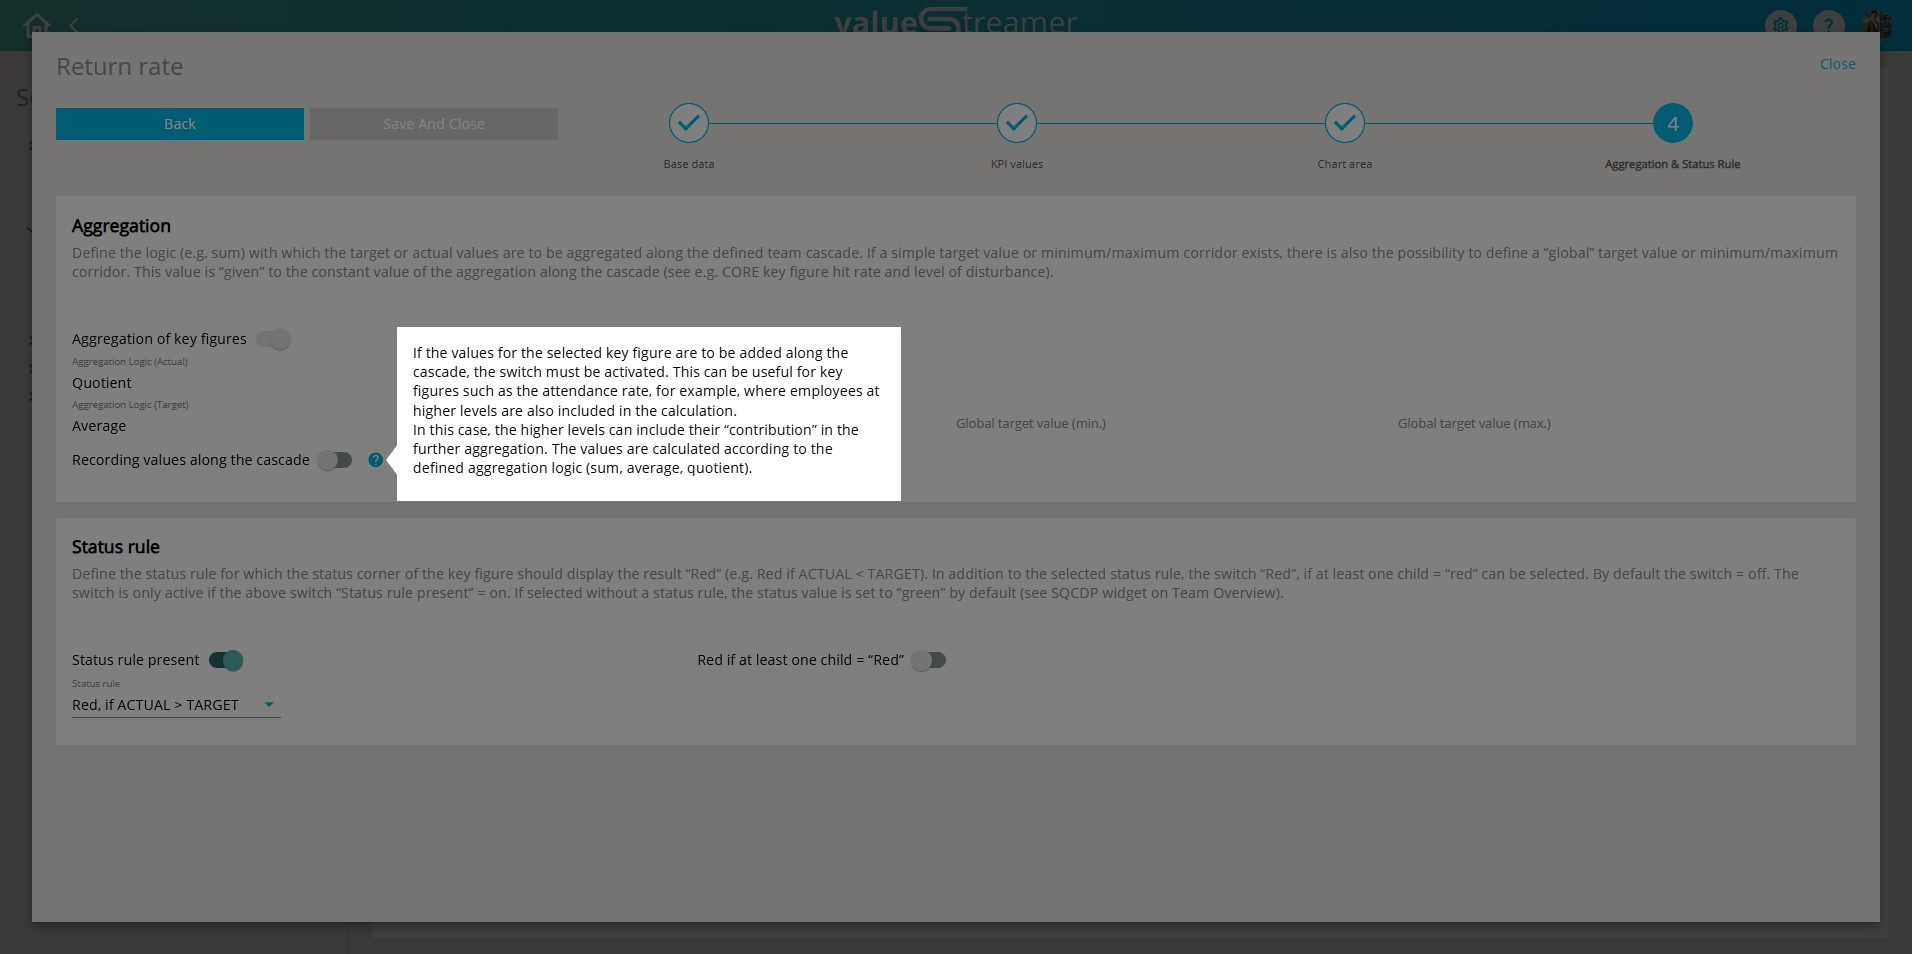
ℹ️ Note: Available only for KPIs with Aggregation = ON.
Recording contributions:
-
Higher levels can manually enter contributions to aggregated KPIs
-
These contributions are integrated into the aggregation logic automatically
Displaying contributions:
-
Teams can decide whether contributions should be displayed as a separate tile
⚠️ Warning: Cascade entries do not overwrite base values – they supplement them in the aggregation process.
4️⃣ Via REST API
👉 For automated data imports (e.g., from MES, Excel, or ERP systems).
ℹ️ This method is only relevant for admins.
📌 See the separate article on API integration or contact your system administrator.
💡 Tips & Notes
-
🔁 Post-entry adjustments: Values can be corrected later if needed.
-
📅 Correct date assignment: Make sure to use the correct recording date – it determines how the value is plotted in the chart.
-
🚩 Mark deviations immediately: Values outside the target range can be flagged right during entry.
❓ FAQ
Can I change or delete already saved values?
→ Yes, if you have write permissions.
How do I know if a KPI value triggered a deviation?
→ Via the color marking and the symbol in the KPI dashboard.
Who can see the values I entered?
→ All team members with read access. In private teams, only authorized individuals.